Debt sustainability: focus on flows

The EFSF/ESM provide loans to euro area countries that have lost sustainable market access or suffered shocks to their banking systems when these problems could spill over to other countries and even destabilise the entire single currency area. The EFSF/ESM have lent substantial funds in six programmes to five euro area Member States – Ireland, Portugal, Greece (second and third programmes), Spain, and Cyprus – and proactively monitor their repayment capacity.
Key to measuring a country’s repayment ability is the analysis of the sustainability of the country’s debt. Different institutions vary in the metrics they use to evaluate sustainability. Clearly, no single metric will deliver a fully reliable country-specific risk assessment of debt sustainability. The ESM’s view on how to best calculate debt sustainability is that the analysis should go beyond the traditionally used debt stock metrics, and link sustainability to debt-flow metrics such as a country’s forthcoming financing needs. Indeed, the ESM’s flow approach to assessing sustainability is also gaining traction at the political level in assessing the situation of Greece.
In line with the ESM’s view, which has long argued against employing only debt stock metrics when assessing short- and medium-term challenges to debt sustainability, the debate now focuses more on the adequacy of GFN, a flow metric that captures forthcoming financing needs. GFN adds up the following elements: interest payments, principal repayments, and the primary deficit. The rationale for using this comprehensive flow metric is that funding shortages occur when there is a mismatch between GFN and financing sources. As a result, the larger the GFN, the harder it is for the sovereign to fill the gap. Thus, while large debt stocks could signal solvency problems, excessive GFN may indicate a heightened risk that the debtor country cannot cover upcoming payment obligations. Linking the concepts of solvency and illiquidity to those of stock and flow metrics is perfectly logical, but the question remains what particular combinations of debt stock and flow features negatively affect debt sustainability.
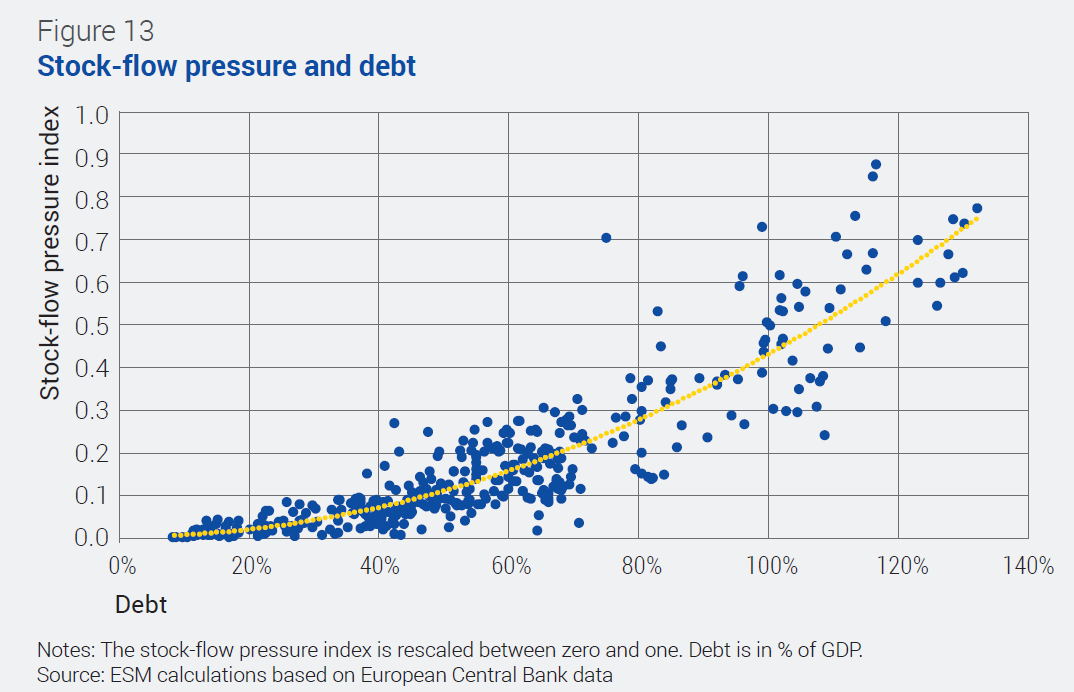
Given the different perspectives, ESM research puts the stock and flow perspective to the test, investigating how the two affect sovereign risk in the eyes of financial markets. The study uses data on sovereign spreads, general government GFN, and debt stocks series for 23 European Union countries from 1995 to 2016.3 To understand the impact of stocks and flows on sovereign risk it is useful to look at them not only individually but also jointly. Market participants may look at them in combination when assessing a country’s creditworthiness. The authors therefore construct a stock-flow pressure (SFP) index which combines the two measures.4 The higher the SFP index, the more the worrying stock and flow debt features coincide and the more disquieting the situation. Figure 13 plots the SFP index against the debt stock. The explosive path of the data cloud reveals that GFN increases more than proportionally as debt stocks increase. This highlights the importance of monitoring GFN as the debt stock increases, which is particularly noteworthy since the ESM must address the problems of highly indebted countries.
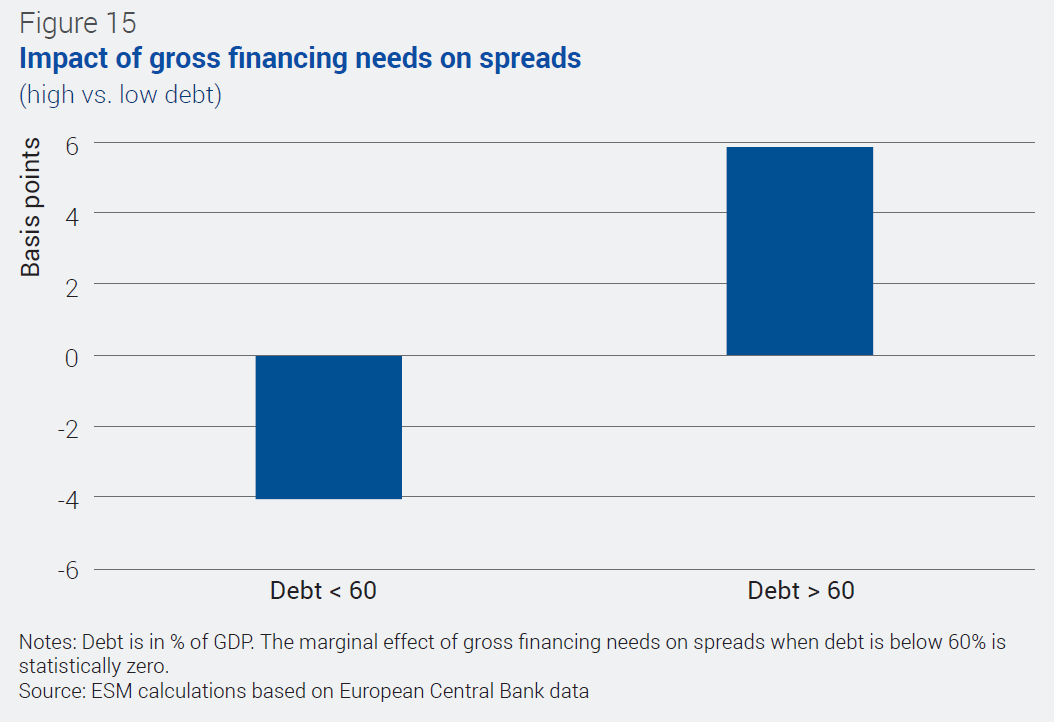
To determine the impact of this metric on credit risk, the study looks into the drivers of 10-year sovereign spreads. Evidently there is a feedback loop here: countries perceived as riskier face higher spreads, and in turn higher costs to borrow funds in the market to repay their debt.5 The results strongly show that both flow and stock metrics are relevant to spread movements. Importantly, however, GFN become increasingly relevant in determining sovereign risk as debt stocks grow. For mild debt stocks increases in GFN are not a concern, but when debt ratios exceed 60%, increases in GFN lead to larger sovereign spreads and more expensive borrowing country interest rates.
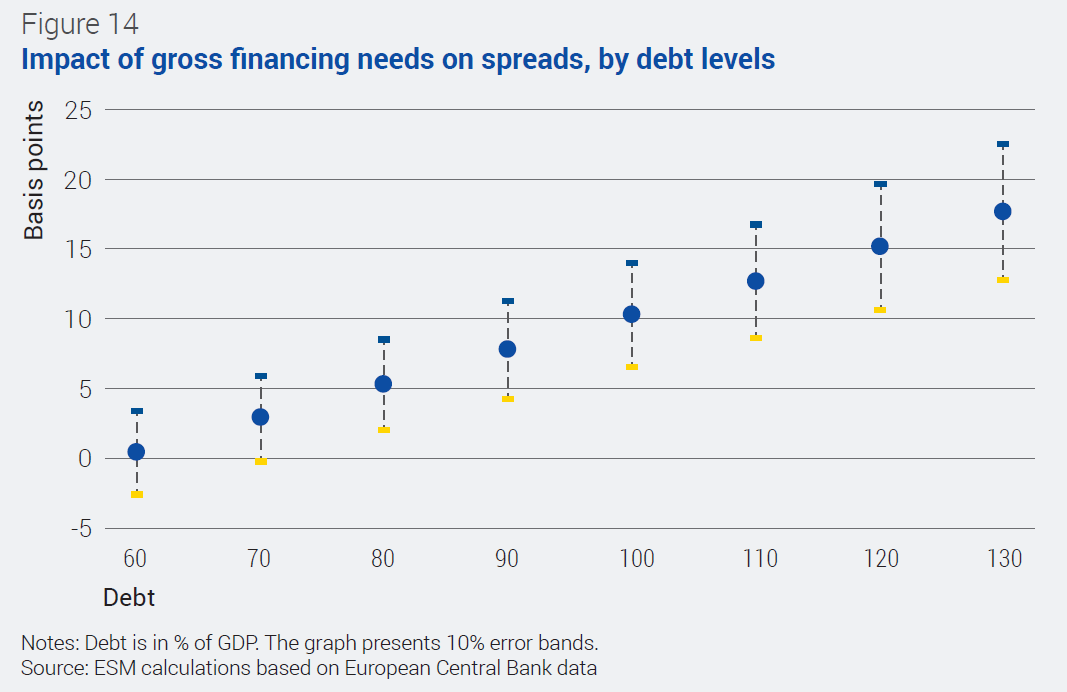
For instance, if a country has a debt-to-GDP ratio of 100%, an increase of one percentage point in GFN translates into an increase in the spread of 10 basis points, all else being equal. Similarly, the same increase in GFN with debt stock at 80% would translate into a five basis point increase in spreads. Equally interesting is the effect of increasing the debt stock by 1% of GDP. Figure 14 plots this effect on spreads at different debt levels. If GFN is above 20%, which the IMF identifies as a critical level, every 1% rise in the debt stock pushes spreads out by more than four basis points. But the impact of the debt level in driving up sovereign spreads is more attenuated than for GFN for levels generally observable in the euro area.
For instance, if a country has a debt-to-GDP ratio of 100%, an increase of one percentage point in GFN translates into an increase in the spread of 10 basis points, all else being equal. Similarly, the same increase in GFN with debt stock at 80% would translate into a five basis point increase in spreads. Equally interesting is the effect of increasing the debt stock by 1% of GDP. Figure 14 plots this effect on spreads at different debt levels. If GFN is above 20%, which the IMF identifies as a critical level, every 1% rise in the debt stock pushes spreads out by more than four basis points. But the impact of the debt level in driving up sovereign spreads is more attenuated than for GFN for levels generally observable in the euro area.
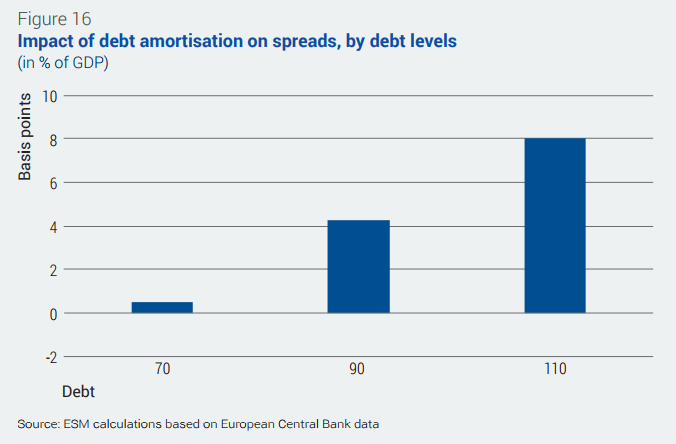
Finally, the results indicate that the debt repayment component is the main driver of debt features. Figure 16 shows that the results are similar to the findings obtained when using overall GFN. According to these estimates, at high debt levels, a one percentage point increase in debt repayments can add more than five basis points to the sovereign spread.
These findings have two important implications. First, they reinforce the need to closely monitor debt flows especially for countries with debt levels above the 60% benchmark established by the European Treaty. Second, the results indicate that the lending terms of ESM loans, which strongly reduce financing needs because less debt roll-over is required, keep spreads narrow and help make market finances accessible and affordable.
3 See ESM Working Paper No. 24, Gabriele et al. (2017), “Debt Stocks Meet Gross Financing Needs: A Flow Perspective into Sustainability”.
4 The authors constructed the index by multiplying, for each country/year pair, debt stock (as % of GDP) and GFN (also as % of GDP), and normalised it to lie between zero and one.
5 The baseline econometric specification, in addition to the measures of debt stock, GFN and the SFP Index, also included real GDP growth, change in debt, and a set of global factors (VIX, world growth and the US 10-year yield). The key coefficients are those quantifying how stock and flow debt metrics, including the compounding SFP Index, translate into risks to sustainability, as measured by sovereign spreads. Our main specification is
![]()